Authoritarianism and its Relevance in Today’s America
Introduction
Throughout history the United States has been looked at as a nation that promotes freedom, runs on checks and balances, and sits on the summit of the “land of opportunities”. Nobody is likely to dispute what you just read but you cannot ignore the incongruity of this with respect to recent happenings within the country. Seems like a blizzard of unreasonable, hard hitting, below the belt blows by the SCOTUS (leaked or not), horrifying school shootings, unprecedented inflation, and most importantly that lump in our throats - are we headed in the right direction? Unfathomable as it may seem, there do exist certain ways of understanding the current situation in the light of an age-old style of parenting that lends itself to answer some of these questions lingering in our minds.
Widespread support for ethnocentric, nationalistic politicians, and policies around the world has renewed interest in authoritarianism, especially over the past few years. Owing to the changes in political dispensation across various countries, authoritarianism has been viewed as a way to measure people’s preferences for right wing populist parties and the ideas they champion. Assessed using a certain set of tested questions to determine the inclination in people’s choices for desirable qualities in children, authoritarian style of parenting has become a marker for political opinions.
Going back in time Authoritarianism has been characterized as the use of power to maintain political status quo, challenge systemic ways that promote political plurality, thwart if need be democratic processes that allow for equal voting rights, and most relevant to recent events - brazenly attack civil liberties and religious freedom.
Studies as recent as May 2021 have shown that authoritarianism has a unique ability to explain present political dynamics. Political scientists working across the realm have proven how asking a specific set of questions can go a long way in extracting information about ideologies that a person supports. In fact, these methods have been vastly vetted in showing how it all bubbles to the top - to institutions trusted with protecting rights of its people and deep roots in authoritarianism can bring down the strongest of democracies.
With this background, we asked our panelists four questions, each having two qualities (a pair) and collected data over a period of 3 months to construct an authoritarian score for each panelist. We then conducted analysis using standard statistical methods, and extended the study by connecting it with congressional voting questions. The following sections will provide a walkthrough of the questions, the data at hand, the methods, and the results.
The panelists were asked the following question over a period of 3 months. The questions were a part of the regular engagement and did not warrant any special consideration with respect to the frequency or priority. This ensured a random sample among the existing panelists.
Questions
Although there are a number of qualities that people feel children should have, every person thinks that some qualities are more important than others. Below is a pair of desirable qualities. For the pair please indicate which quality you think is more important for a child to have…
Obedience/Self-reliance
Respect for elders/independence
Good manners/curiosity
Well-behaved/Being considerate
Respondents allocated a score to each quality within a pair, such that the total adds up to 100. For example, for the first pair, a panelist may allocate 40 to obedience and 60 to self reliance. A key point here is that each panelist has answered all the questions at least once.
The key differentiator in the Trendency way of collecting data is the ability to provide nuanced responses and not show just a binary preference to the answer options. This allowed us to assess how far across the opinions spread and how certain states have responded to these universally established sets of questions. A fairly straightforward method to calculate the mean allocation scores was followed. The overall process was divided into two stages, one that takes into account the allocation based approach while another that normalizes the values to arrive at an index.
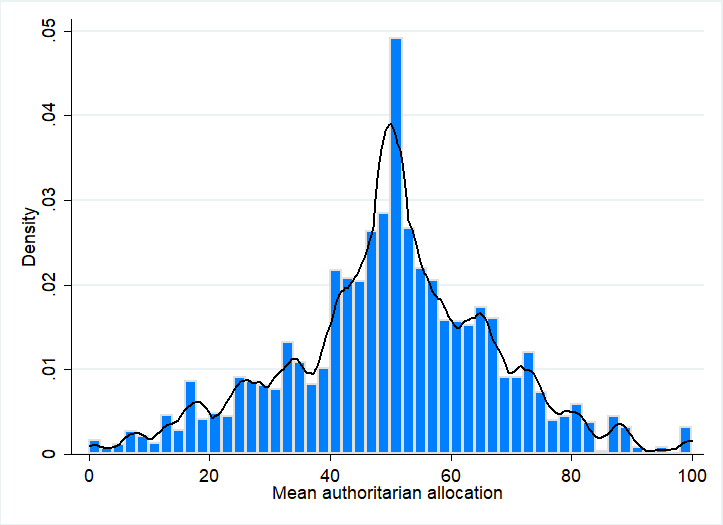
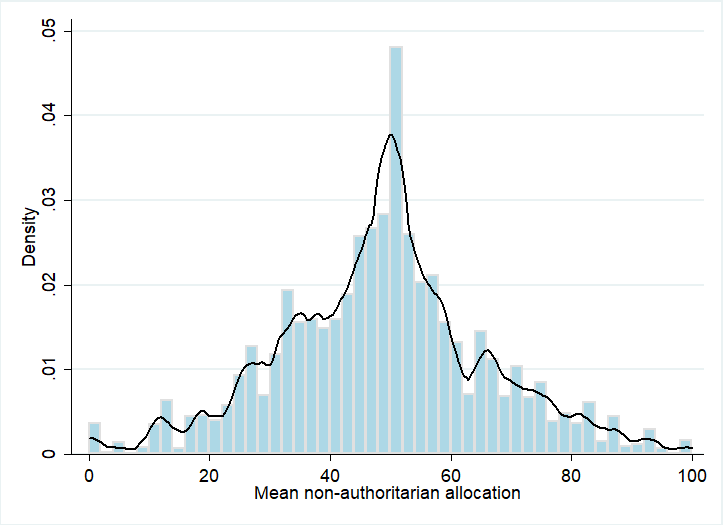
Moving to the main results shown in Figure 1 and 2, it is extraordinarily clear that the allocation method of allowing panelists to assign a score to both qualities within a pair assists in visualizing the spread of opinions. This is not possible with just a binary allocation of 0 or 1 to each attribute, something that is in practice in all the research conducted in this area. There is almost an equal allocation of scores for both types of qualities, authoritarian and non-authoritarian. Results also suggest that the majority of individuals are not displaying preference for entirely a single type of attribute within the pair, rather, have both sides of the parenting spectrum.
Figure 1: Mean allocation of authoritarian qualities
Figure 2: Mean allocation of non-authoritarian qualities
Table 1: Age wise breakdown of allocation
Looking at the differences between the age groups, shown above in Table 1, it is evident that the younger people under 35 have the highest average allocation of about 57 to non-authoritarian qualities, while the older people have allocated relatively higher scores to the authoritarian qualities. Even between the ages of 35 and 54, average authoritarian allocation is only slightly higher, indicating that parents of this age are more focussed on a balance of qualities. This is completely in line with the trends observed in research literature and corroborates the fact that age plays a major role in how perceptions regarding policies are shaped.
The differences between allocation of scores by race (Figure 3) shows that white respondents have the most balanced opinion on this matter while African Americans have the highest Authoritarian allocation. Conversely, the Latino/Hispanic population allocated larger valued scores to the Non-Authoritarian qualities. Speaking of the split based on party affiliation, there were no significant alterations in the likely trends with Republicans showing the maximum authoritarian qualities followed by independents. Democrats ranked the highest for the non-authoritarian attributes. The numbers are shown in Figure 4 below.
Figure 3: Mean allocation by race categories
Figure 4: Mean allocation by party affiliation
Since most of this work has been done to understand how voting behavior may be affected by the inclination towards authoritarian versus non-authoritarian qualities, regression analysis was conducted by using voting related questions. These questions were asked during an earlier time frame and assessed:
Which presidential candidate would people vote for (Trump, Biden, Other)
Whether they approve Biden’s performance, (Approve, Disapprove, Indifferent)
Which party they would choose during congressional voting (Democratic party, Republican party, Other), and
Whether they favor Biden as president (Favorable, Unfavorable, Neutral)
A subset of the sample who had responded to both groups of questions, i.e, the authoritarian parenting ones and the aforementioned voting questions, were used for building a logistic regression model. All those individuals who had chosen Biden, approved of his performance, favored him as President, and opted for the Democratic party were categorized as the Biden camp. On the other hand, the exact opposite choices were part of the Trump camp. The allocation scores were used as a predictor of voting behavior.
In simple terms, the regression model can be understood as:
If you are a part of the Biden camp, then a value of 1 will be assigned against your name and 0 otherwise. Similarly, if you are a part of the Trump camp, a value of 1 will be assigned to you and 0 otherwise. Using this as the main outcome variable, the authoritarian/non-authoritarian scores were used as the predictors of which way someone would vote.
Closely following expected results, our data showed that the higher the authoritarian allocation the higher the chances are for choosing Trump or the Republican party, while it was the converse for the non-authoritarian case. The directionality and magnitude of results remained consistent despite controlling for age, race, and party affiliation.
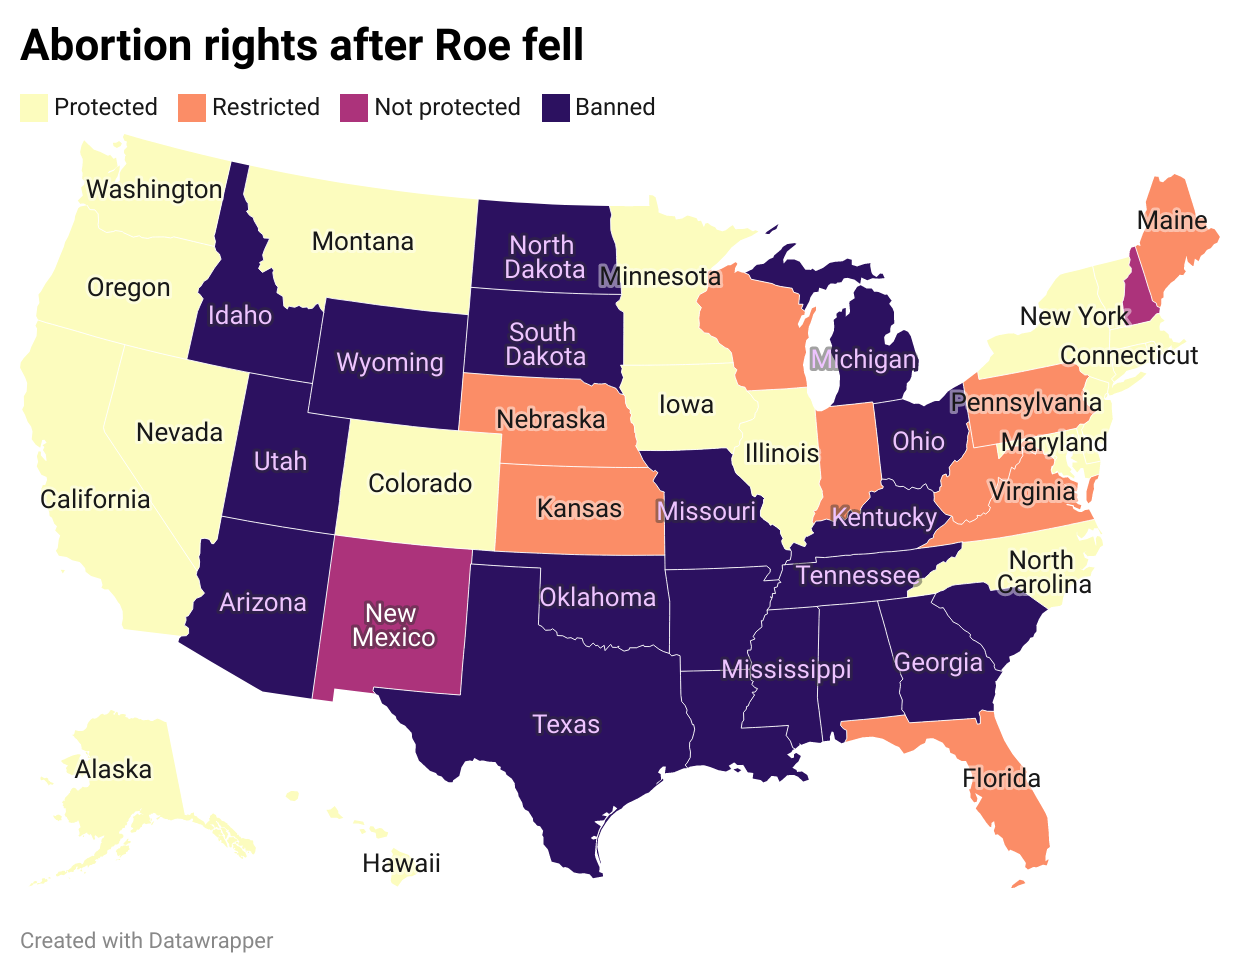
Focusing on why this matters in the light of recent events around civil rights, race, sexism, and vote choice; quite clearly, the so-called flag-bearers of protecting democracy are getting it all wrong by choosing to exercise power that is quite close to autocracy and ruthless disregard for equality or equitability. Our results show how age, gender, race, and party affiliation are connected to the choices people make in daily lives to how it translated into policy positions affecting millions of people and more adversely, the marginalized and vulnerable sections of society. As an example that will highlight this stance, just a quick glance at the map below delineates how authoritarian scores and policy matters move hand-in-hand.
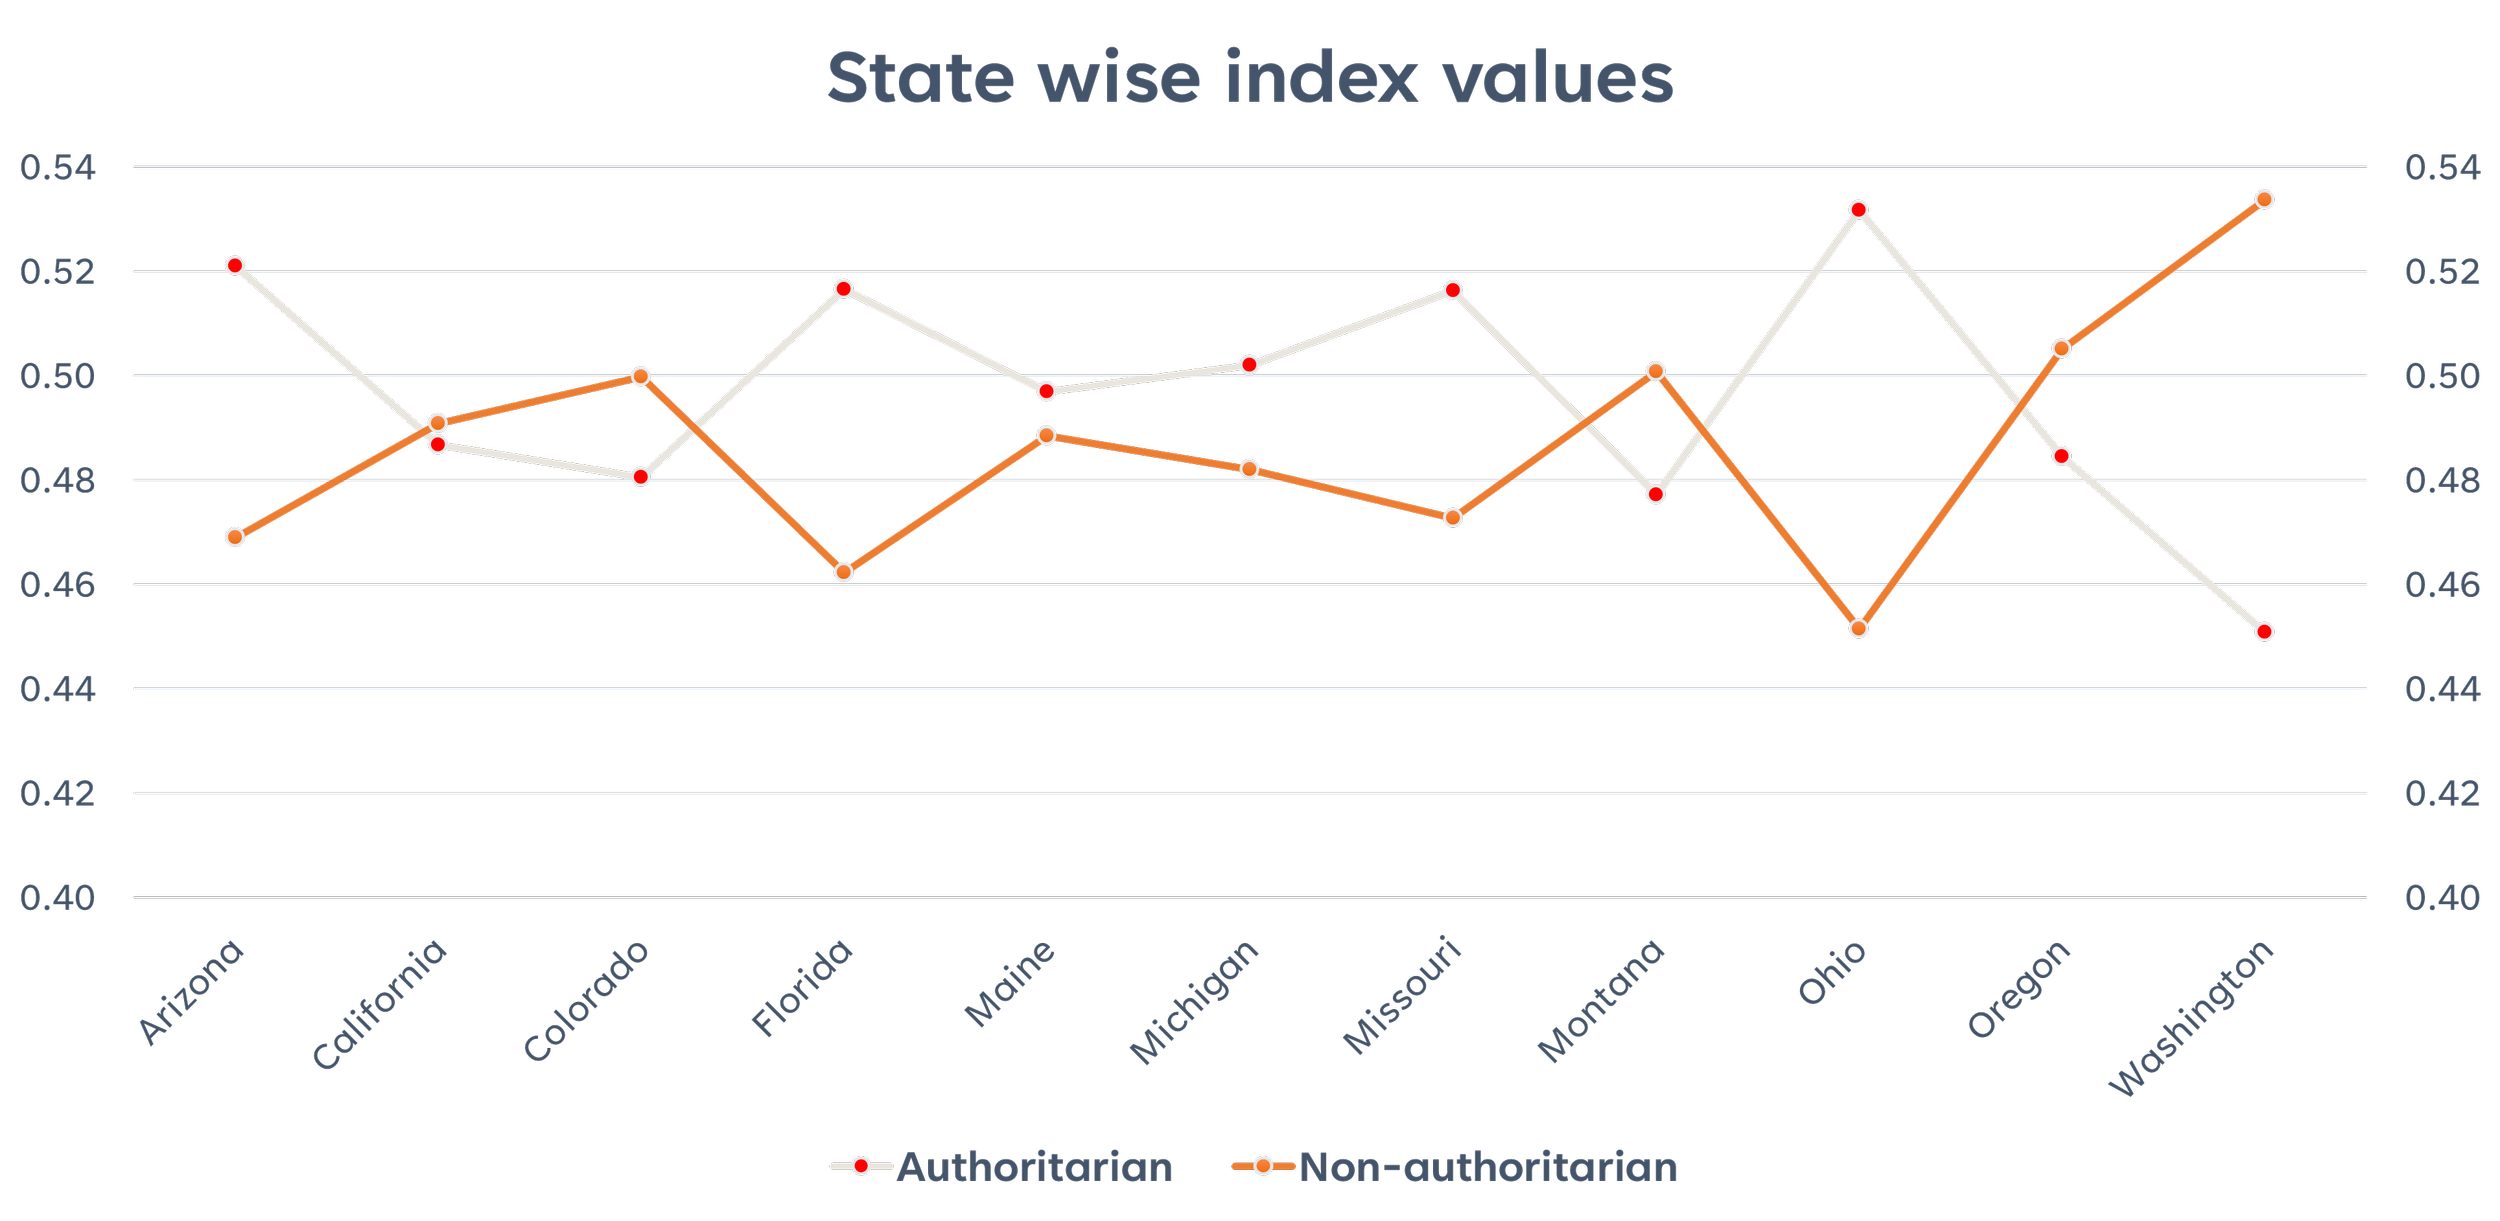
Looking at a subset of states, we see that states that tend to have a more conservative political leaning tend to have a higher concentration of authoritarian minded citizens. In the chart below, we see that states such as Arizona, Florida, and Ohio have a much higher concentration on the authoritarian scale (the red dots) versus those who hold a non-authoritarian frame (orange line).
Figure 5: State wise values for authoritarian and non-authoritarian scores
Looking at the states of California, Ohio, Florida, and Arizona as examples, it is evident that states with high authoritarian scores have either banned or restricted access to a safe abortion (AZ, FL, and OH) while CA has gone ahead and instituted protection for reproductive rights. Comparisons between similar policy positions and authoritarian scores can be drawn across various civil and human rights-related matters.
To conclude, no one has a binary way of thinking or choosing between options. It just never happens and never will. What remains relevant is that as nations are wrestling with social, economic, and geopolitical unrest, allowing for systems that retain the ethos around which an institution was designed to deliver justice will help healthier democracies thrive. No one wants an erosion of civil rights and populists enjoying resounding success at the ballot box. Instead, political parties have to and must build coalition, win elections, and bat for pro-choice lifestyle. After all, the America we all know is meant to remain a land of opportunities, and set an example for other countries.


